Collapse
Submit a Service Request
Contact Information for Technical Support
My Service Notifications
How do I check Apache Logs for my site?
Answer ID 12756 |
Last Review Date
Where can I find webserver (Apache) logs for my site?
Frequently customers need to be able to check webserver traffic against their sites, for use cases like (1) security audits (2) debugging customizations or (3) checking usage. As of December, 2023 there is self-service functionality through Configuration Assistant to allow your site administrators to request and download Apache Logs yourself.
Step 1 is making sure you have access to Configuration Assistant. You can get information about your Configuration Assistant URL from the Site Info page. If you do not have access to Configuration Assistant, please ask a site administrator within your organization to create an account for you. If no site administrators are still with your organization, please submit a Service Request. In that case, do note that for security reasons there may be additional validation steps required to provision a new site administrator for your service.
Requesting Logs
(1) Once you have logged into Configuration Assistant, you should see an Administration button in the top left:

(2) Click on that! In the next page, you should see the Request Apache Logs widget:
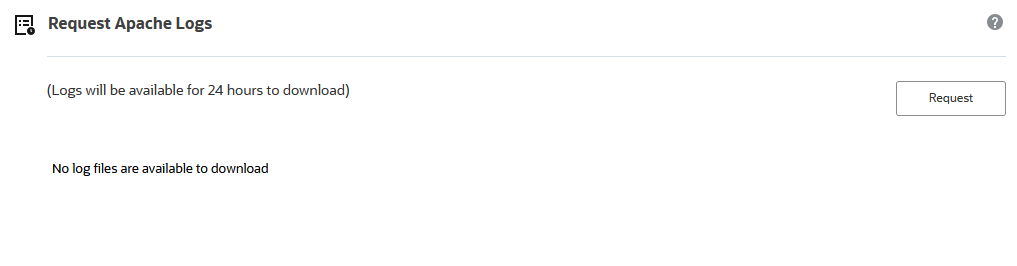
(3) Hitting the Request button will show you the options you have for Apache Log generation:
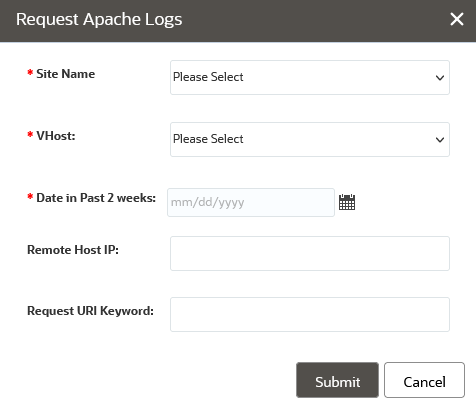
Site Name: This should be populated with all of the sites associated with the identity domain you are logged into. Note that if your organization manages multiple identity domains, they will not all be listed in a single dropdown. You will need to log into the appropriate Configuration Assistant url (as indicated by the Site Info page) for each one.
VHost: This will list all of the different VHOSTs available on the site you selected. Usually this will just be a list of the different interfaces on that site. Select the one you need logs for.
Date in the Past 2 Weeks: Select the day you want logs for. Because these logs can be extremely large, you will not be able to select date ranges. If you need multiple dates, please run those requests separately.
Remote Host IP: This allows you to filter the logs by the exact originating IP address for traffic you want to examine. This field does not accept wildcards. Use this filter if you have particular traffic from a particular source you want to review
Request URI Keyword This allows you to filter for only traffic with particular text in the URI. For example, if you wished to find all Customer Portal traffic and filter out admin-side traffic, you might put /app/ in this field. If you wanted specifically hits to custom scripts, you might put /php/custom/
As noted, these files can be very large, so it is highly recommended that you filter them as much as possible while still meeting your requirements.
(4) After you hit Submit, you should eventually see your logs available for download. You can hit the Refresh button in the top right to see if they have completed processing. Once they are available, they will be displayed like this:
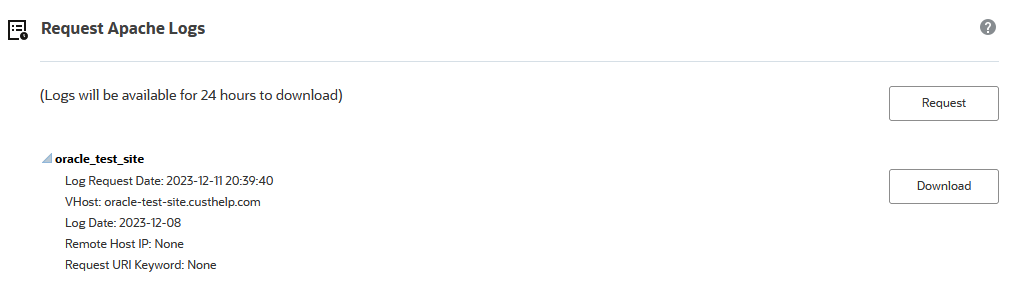
(5) Click the Download button to request the log. As noted in the screenshot, logs will be purged after 24 hours. Again, this is necessary due to the size of these logs.
If you have any questions or issues with using this tool, please don't hesitate to Submit a Service Request