How can I begin development of an Analytics BUI Extension for External Data?
Environment:
Agent Browser UI Extensibility Framework
External Objects (XO)
Issue:
How can I create a BUI virtual table report to serve up data residing outside of Oracle B2C Service?
Resolution:
This answer is a step-by-step guide clearing up frequently asked questions on implementing a report from external data. This answer acts as an extension of the official documentation located here . All source code used in this guide is available for download and is attached to this answer as 'Analytics_for_External_Data.zip'.
Below you will find some general answer content guidelines and writing tips.
Click the  next to the appropriate heading below to expand that section for viewing.
Step 1: Create the Virtual Table Definition
You use a JSON file to define the table structure, and then you upload the file using the Add-In Manager. The following code will add a table called 'Package$Table' into the Data Dictionary.
Below is a sample table structure for our "Hello World" example. This file is included in the attached sample source code as well.
{
"reportTablePackages": [{
	"name": "Package",
	"tables": [{
		"name": "Table",
		"label": "Table",
		"description": "EMPLOYEE TABLE",
		"columns": [{
				"name": "EMP_DISPLAY_NAME",
				"label": "EMPLOYEE DISPLAY NAME",
				"description": "EMPLOYEE DISPLAY NAME",
				"dataType": 3,
				"canDisplay": true,
				"canFilter": true,
				"canEdit": false,
				"isKey": true,
				"isNullable": true
			},
			{
				"name": "EMP_NAME",
				"label": "EMPLOYEE NAME",
				"description": "EMPLOYEE NAME",
				"dataType": 3,
				"canDisplay": true,
				"canFilter": true,
				"canEdit": false,
				"isKey": true,
				"isNullable": true
			}]
		}]
	}]
}
In order to define the table parameters for your specific data, please reference the following table.
| Parameter | Description |
|---|---|
| canDisplay | Whether the column is displayed |
| canEdit | Whether the column can be edited |
| canFilter | Whether the column can be added to a filter |
| dataType | Column data types:
|
| description |
|
| isKey | Whether the column is a primary key |
| isNullable | Whether the column can contain null data |
| label |
|
| name |
Note: The total length of the table name plus the package name must be 33 characters or fewer. |
Step 2: Create the Analytics table definition
- From within the .NET console navigate to the Add-In manager
- Create a new analytics BUI Extension
- Upload the attached source code (attached to this answer)
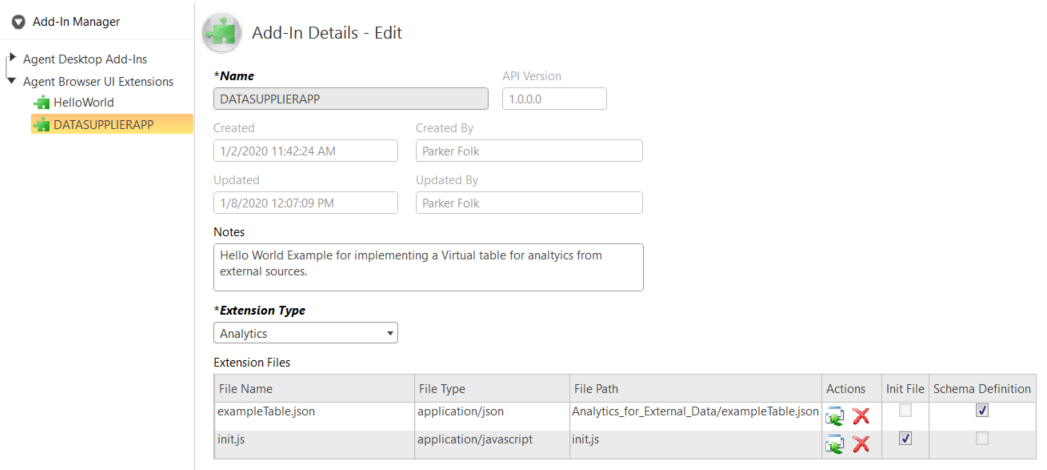
- Ensure that the name of the extensions is 'DATASUPPLIERAPP' as that is the name defined in the init.js file.
-
Your configuration at this point should look like this:
-
Give the Extension the proper profile permissions
-
Save and close the Add-In Manager
-
Logout and log back into the Agent Desktop ( **Don't skip this step** )
Step 3: Create the Virtual Table Report
Now that we have uploaded the BUI extension that included our table definition, we should a new entry in our data dictionary. In this step we will build our virtual report based off of this definition.
- Open the Reports Explorer
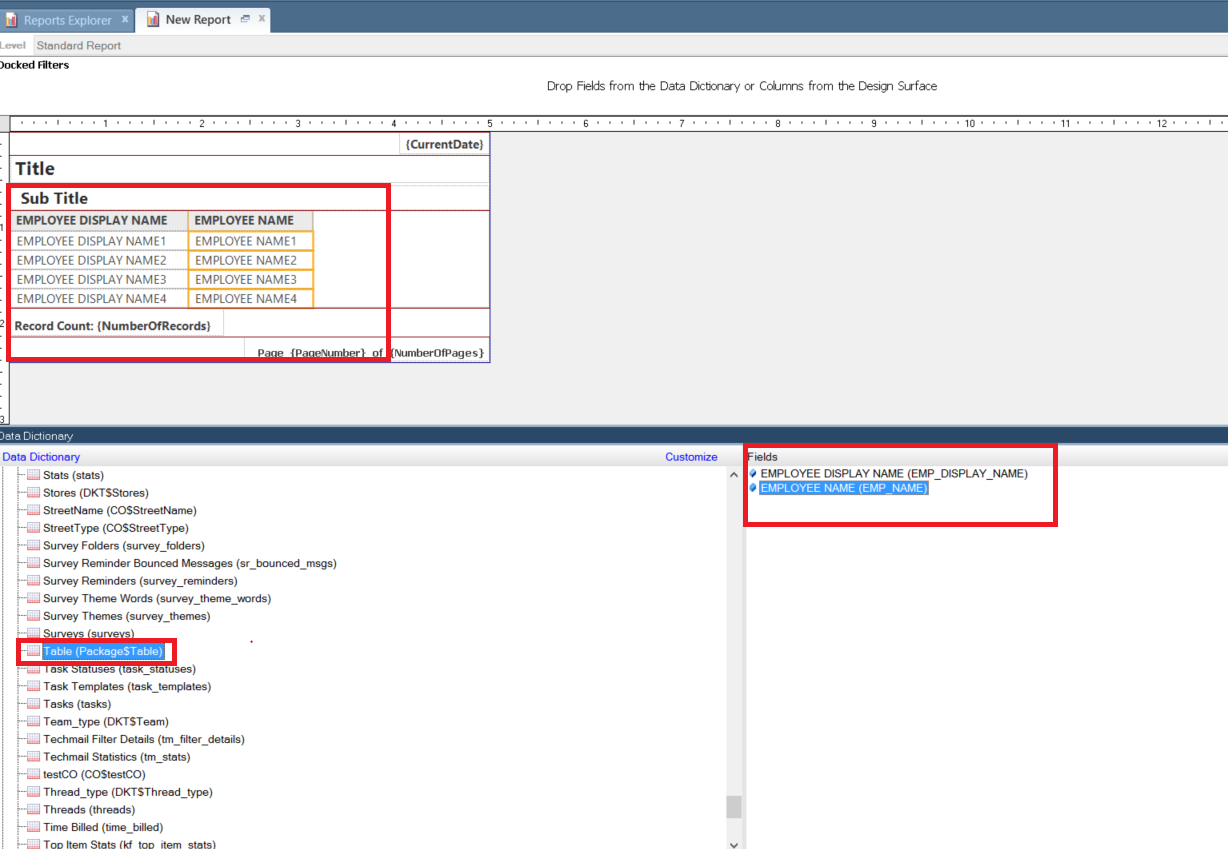
- Create a new Blank Report
-
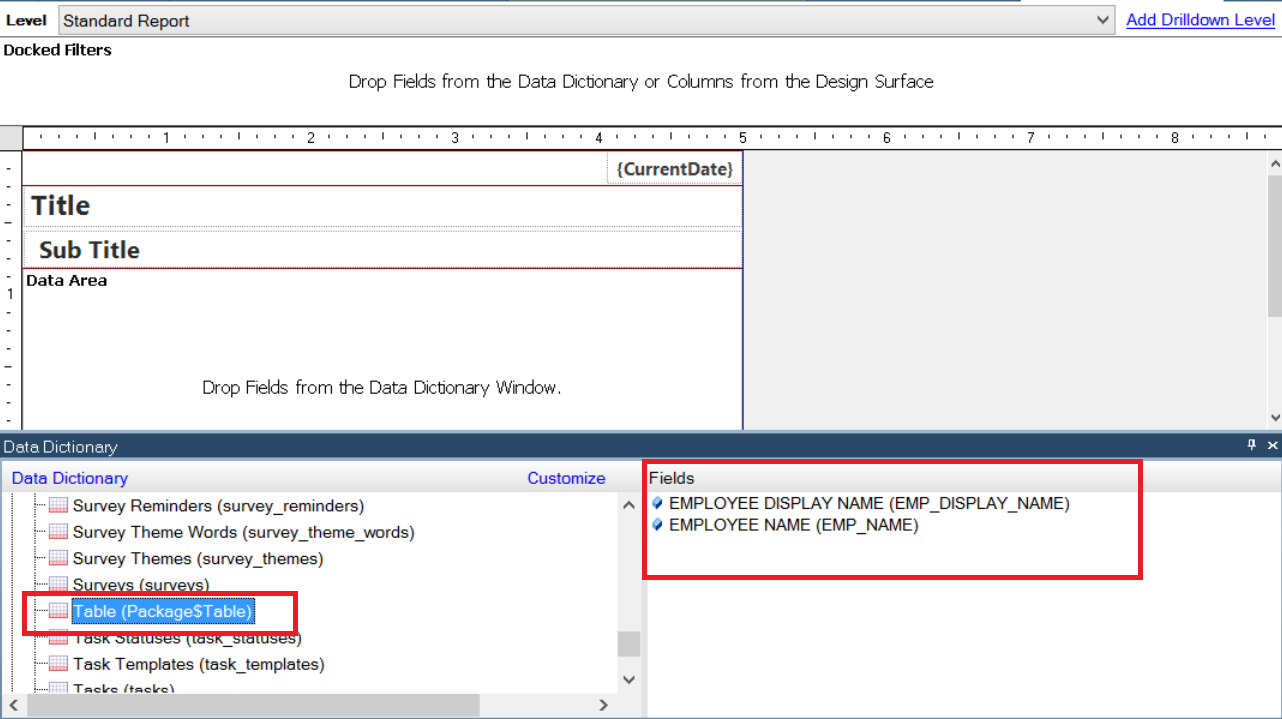
You can see that your virtual table is listed in the Data Dictionary section as 'Table (Package$Table) '
-
Create a report based on that report
- Add any filters if necessary
- Now you can add this report into the BUI anywhere you can add any other report (quick search, navigation set, workspace etc. )
Note: Since you have not yet provided any data for this virtual table this report will not show any rows. In order to supply data for the external report you need to proceed to step 4.
Step 4: Register the user function to supply data for the table
For this step we will use the addTableDataRequestListener call back function to supply data to the report we just created. Below is an example javascript code that creates and populates the report from external sources. The code is heavily commented for clarity. You will select this file as the main file for our example.
ORACLE_SERVICE_CLOUD.extension_loader.load('DATASUPPLIERAPP')
.then(function(IExtensionProvider)
{
IExtensionProvider.registerAnalyticsExtension(function(IAnalyticsContext)
{
IAnalyticsContext.addTableDataRequestListener('Package$Table', sampleDataSupplier);
});
});
function sampleDataSupplier(reportObject)
{
// Create an object for returning data.
var reportData = reportObject.createReportData();
// Create the first row.
var reportRow1 = reportObject.createReportDataRow();
// Create the second row.
var reportRow2 = reportObject.createReportDataRow();
// Create a column and set the data.
var row1Col1 = reportObject.createReportDataCell();
row1Col1.setData('row 1 col1 data');
var row1Col2 = reportObject.createReportDataCell();
row1Col2.setData('row 1 col2 data');
var row2Col1 = reportObject.createReportDataCell();
row2Col1.setData('row 2 col1 data');
var row2Col2 = reportObject.createReportDataCell();
row2Col2.setData('row 2 col2 data');
// Create record information for the first row.
var row1recordInfo = reportObject.createReportRecordInfo();
row1recordInfo.setRecordType('Contact');
row1recordInfo.setRecordId(52);
// Create record information for the second row.
var row2recordInfo = reportObject.createReportRecordInfo();
row2recordInfo.setRecordType('Contact');
row2recordInfo.setRecordId(53);
// Associate the first row with columns.
reportRow1.getCells().push(row1Col1);
reportRow1.getCells().push(row1Col2);
// Associate the second row with columns.
reportRow2.getCells().push(row2Col1);
reportRow2.getCells().push(row2Col2);
// Associate the first row with getRecordInfo.
reportRow1.getRecordInfoList().push(row1recordInfo);
// Associate the second row with getRecordInfo.
reportRow2.getRecordInfoList().push(row2recordInfo);
// Associate rows with the data to be returned.
reportData.getRows().push(reportRow1);
reportData.getRows().push(reportRow2);
return reportData;
}
Step 5 (Optional): Add the Virtual Report to an Incident Workspace
- Create a new standard incident workspace
- Add a report control to any tab
- Select the virtual table report that we created in steps 1-3.
-
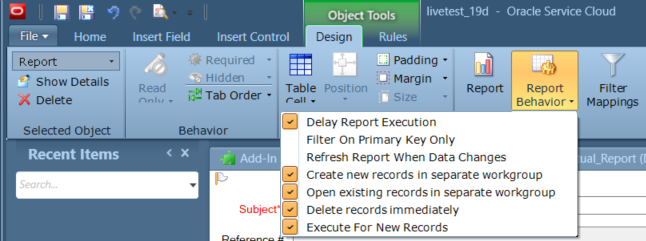
Set the following Report Behavior configurations:
-
Assign this workspace to the profile you are using.
-
Log into BUI and open a new incident.
-
Open the tab you added the report to. In Chrome Developer tools notice the message "sampleDataSupplier function called!!" printed to the console. The report should also be populated with the dummy data we created in step 3.
If you are still unable to see the virtual table report, please reference Answer ID 11312: Why is the addTableDataRequestListener call back function not being called in my Analytics for External Data BUI extension?